Study Shows Police Stop Black People Based on How They Look, Not How They Drive
/
From [HERE] In 2018, police officers initiated contact with nearly 29 million U.S. residents aged 16 and older: traffic stops comprise over four-fifths of police-initiated contact.48 There are clear racial disparities in traffic law enforcement. For example, the Stanford Open Policing Project’s dataset of nearly 100 million stops collected from 21 state patrol agencies and 35 municipal police departments reveals that these agencies were more likely to stop Black, but not Latinx, versus white drivers between 2011 and 2018.49 Echoing findings from other ‘veil of darkness’ analyses, this study also found that officers stopped Black drivers less often after sunset, when a driver’s racial identity is less visible.50 Studies of jurisdictions including Connecticut, Massachusetts, North Carolina, and South Carolina have also found significant racial disparities in police stops.51 On the other hand, national surveys of drivers since 2002 have found racial disparities in traffic stops only in some years.52 But a closer look at the causes of traffic stops reveals that officers stop Black drivers for less serious reasons than white drivers.
Charles Epp of University of Kansas and his colleagues have shed light on investigatory traffic stops. These are distinct from traffic-safety stops, which are based on factors such as speeding at greater than seven miles per hour, suspicion of driving under the influence of drugs or alcohol, running a red light, or reckless driving. The pretext for investigatory stops, on the other hand, may be for such infractions as failure to signal a turn or lane change, having a malfunctioning light or expired license tag, driving too slowly, or stopping too long—or for the officer to check for a valid license or to conduct a warrant check. The objective of these stops is to investigate drivers deemed suspicious. This is a form of proactive policing that uses minor traffic violations as a pretext for a criminal investigation and helps raise municipal revenues through fines and fees.53 Traffic-safety stops, the researchers found, are based on “how people drive,” whereas investigatory stops are based on “how they look.”54
Epp and colleagues’ study of police stops between 2003 and 2004 in Kansas City found that investigatory stops differed significantly by race while rates of traffic-safety stops did not.55 These differences existed for all ages, however, they were sharpest among drivers under age 25: among these drivers, 28% of Black men had experienced an investigatory stop as had 17% of Black women, compared to 13% of white men and 7% of white women. Socioeconomic differences did not fully explain this racial disparity: Black drivers under age 40 were over twice as likely as their white counterparts to experience investigatory stops for both the highest- and lowest-valued cars. More recently, University of North Carolina professor Frank R. Baumgartner and colleagues analyzed over 20 million stops in North Carolina between 2002 and 2016 and found that the majority of stops that white drivers experienced (56%) were for traffic safety reasons, while the majority of stops that Black drivers experienced (52%) were for investigatory reasons.56 Directing officers to make investigatory stops, Epp and colleagues argue, opens the door to biased policing based on stereotypes of Black criminality.
Pedestrian Stops and Order-Maintenance Policing
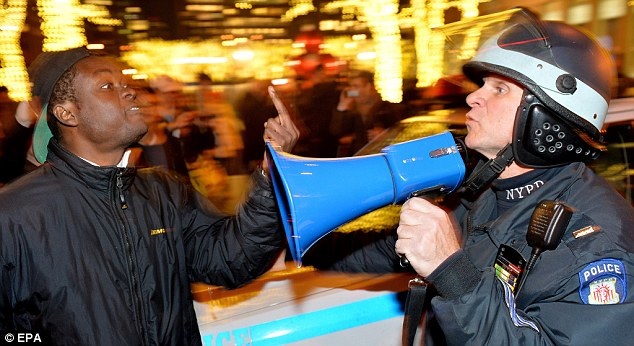
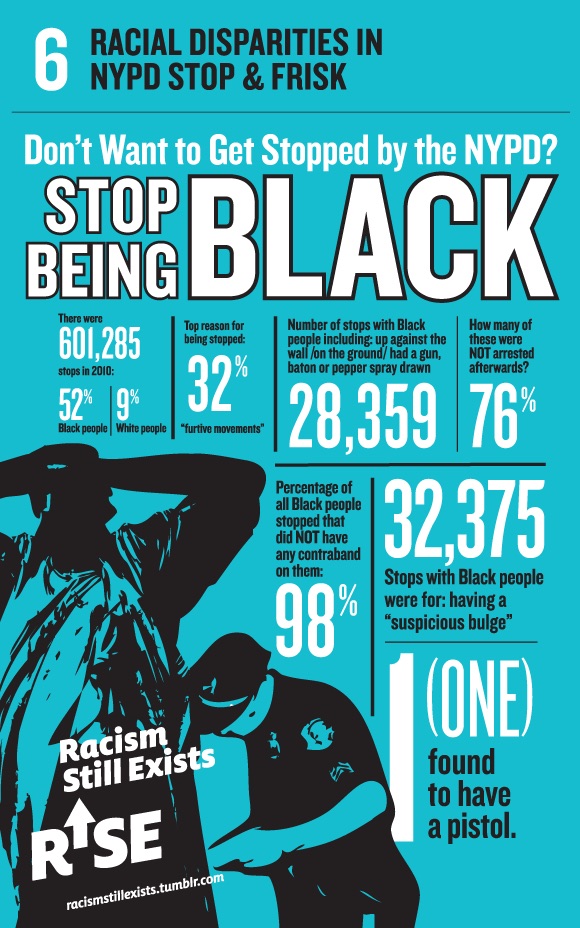
Similar disparities arise in investigative pedestrian stops and with order-maintenance policing. In 2013, Judge Shira A. Scheindlin concluded, regarding New York City’s stop-and-frisk tactic, that the city’s “highest officials have turned a blind eye to the evidence that officers are conducting stops in a racially discriminatory manner.”57 The police policy broadly targets male residents of neighborhoods populated by low-income people of color to uncover drugs and weapons. Despite evidence finding the tactic to be ineffective, a conclusion that was reinforced when New York City continued its crime decline after scaling back stop and frisk, related forms of policing persist in many other cities.58 For example, a 2022 analysis of the Milwaukee Police Department’s stop-and-frisk practices, conducted by the Crime and Justice Institute, found that Black residents were 4.5 times as likely to get pulled over, 10.1 times as likely to be subjected to a field interview, and 2.6 times as likely to be frisked as white residents.59
Further, in 2022, New York City Mayor Eric Adams re-embraced ‘broken windows’ policing, a policy seeking to promote public safety by clamping down on petty, ‘quality-of-life’ offenses and disorder through arrests.60 Order-maintenance policing persists despite the limited evidence to support its efficacy and great cause for concern about its negative impact, disproportionately on people of color.61
Stop Outcomes: Searches, Arrests, and Police Violence
National surveys, as well as studies of specific jurisdictions, reveal disparities in the outcomes of police stops. After pulling a driver over for a traffic stop in 2018, officers nationwide searched Black and Latinx drivers 1.7 and 2.6 times as often as whites, respectively.62 This disparity holds even though police are less likely to find illegal drugs, weapons, or other forms of contraband such as stolen goods in the cars of Black and Latinx drivers than those of whites.63 These patterns of ‘contraband hit rates’ have been found in jurisdictions across the country, including Philadelphia, Missouri, and California.64 Because they are searched so much more frequently, Black and Latinx drivers are arrested more frequently than whites in police stops—a disparity that would be reduced if they were searched at the same rate as whites.65
Police violence also differs by race. In recent years, police officers have threatened or used non-fatal force in about 3% of encounters that they initiated or which resulted from a traffic accident.66 But they have been over 2.5 times as likely to use or threaten force against Black individuals as whites (5.5% versus 2.1% in 2020) and more likely to do so against Latinx individuals (3.4%) than whites as well.67 Researchers have also identified racial disparities in how respectfully police officers speak to stopped drivers, based on body-worn camera footage from Oakland, CA.68
Racial disparities are also stark in relation to who police officers kill. Black Americans were 2.5 times as likely to be shot and killed by police officers as whites, and Latinx people were 1.2 times as likely, between 2015 and 2021.69 At this rate, police will kill an estimated one in 1,000 Black men.70 Police officers’ greater inclination to stop and search people of color suggests that differences in people’s behavior alone are unlikely to account for disparities in lethal police violence. [MORE]
48.
Overall, 62 million U.S. residents had contact with the police in 2018, which includes 35 million interactions that people initiated and nine million interactions related to a traffic accident (all forms of police contact add up to more than the total since some individuals experienced multiple types of contact). Of the approximately 24 million traffic stop encounters in 2018, 18.7 million (77%) were experienced by drivers and 5.7 million (23%) were experienced by passengers. Tapp & Davis. (2022), see note 13.
This study found the state-patrol stop rate to be 7% for whites, 10% for Blacks, 5% for Latinxs. The municipal-police stop rate was 14% for whites, 20% for Blacks, 9% for Latinxs. Pierson, E., Simoiu, C., Overgoor, J., Corbett-Davies, S., Jenson, D., Shoemaker, A., Ramachandran, V., Barghouty, P., Phillips, C., Shroff, R., & Goel, S. (2020). A large-scale analysis of racial disparities in police stops across the United States. Nature Human Behaviour, 4(7), 736–745. https://doi.org/10.1038/s41562-020-0858-1
See Grogger, J. & Ridgeway, G. (2006). Testing for racial profiling in traffic stops from behind a veil of darkness. Journal of the American Statistical Association. 101, 878–887. https://doi.org/10.1198/016214506000000168.
Barone, K., Fazzalaro, J., Kalinowski, J., & Ross, M. B. (2022) Traffic stop data analysis and findings, 2020. Institute for Municipal and Regional Policy, University of Connecticut; Flingai, S., Sahaf, M., Battle, N. & Castaneda, S. (2022). An analysis of racial disparities in police traffic stops in Suffolk County, Massachusetts, from 2010 to 2019. Vera Institute of Justice; Baumgartner, F., Epp, D., & Shoub, K. (2018). Suspect citizens: What 20 million traffic stops tell us about policing and race. Cambridge University Press; Horn, C. (2020, June 12.) Racial disparities revealed in massive traffic stop dataset. University of South Carolina.
Bureau of Justice Statistics. Contacts between police and the public.
McIntire, M., & Keller, M. H. (2021, November 3). The demand for money behind many police traffic stops. The New York Times.
Epp, C. R., Maynard-Moody, S., & Haider-Markel, D. P. (2014). Pulled over: How police stops define race and citizenship. University of Chicago Press, p. 64, emphasis in original.
This study is based on drivers’ reports of officers’ reasons for the stop. Epp, Maynard-Moody, & Haider-Markel (2014), see note 54; for a similar study of traffic stops for non-moving violations in California, see Muhammad et al. (2022), see note 10.
Latinx drivers in North Carolina were also more likely to be stopped for investigatory rather than for traffic safety reasons. Baumgartner, Epp, & Shoub (2018), see note 51.
Floyd v. City of N.Y., 959 F. Supp. 2d 540, 562 (S.D.N.Y. 2013).
Rosenfeld, R. & Fornango, R. (2014). The impact of police stops on precinct robbery and burglary rates in New York City. Justice Quarterly, 31(1), 96-122. https://doi.org/10.1080/07418825.2012.712152; Keating, D., & Stevens, H. (2020, February 27). Bloomberg said ‘stop and frisk’ decreased crime. Data suggests it wasn’t a major factor in cutting felonies.
Crime and Justice Institute (2022). City of Milwaukee settlement agreement: Analysis of 2022 traffic stops, field interviews, no-action encounters, and frisks; ACLU-DC & ACLU Analytics. (2020). Racial disparities in stops by the DC Metropolitan Police Department: Review of five months of data; Wisconsin State Journal. (2022, May 12). ACLU, Milwaukee police stop-and-frisk resolution efforts continue; ACLU Illinois. (2023). Stop and frisk; Palmer, C., & Orso, A. (2023, March 17). Stop-and-frisk is getting renewed attention in Philly amid a mayor’s race focused on crime. The Philadelphia Inquirer.
Goodman, J. D. (2017, October 20). Fewer criminal tickets for petty crimes, like public urination. The New York Times; Konig, J. (2022, March 23). NYPD launches “quality-of-life” initiative that critics call return to “broken windows” policing. Spectrum News NY1.
Weisburd, D., & Majmundar, M. K. (Eds.) (2018). Proactive policing: Effects on crime and communities. National Academies of Sciences, Engineering, and Medicine. https://doi.org/10.17226/24928
Tapp & Davis. (2022), see note 13.
Harris, D. (2012). Hearing on “Ending Racial Profiling in America,” Testimony of David A. Harris. United States Senate Judiciary Committee, Subcommittee on the Constitution, Civil Rights, and Human Rights; Pierson et al. (2020), see note 49.
Melamed (2019), see note 14; Missouri Attorney General. (2019). Vehicle stops executive summary; Muhammad et al. (2022), see note 10; Lofstrom et al. (2021), see note 14.
Tapp & Davis (2022), see note 13; Muhammad et al. (2022), see note 10.
This includes if the officer threatened force, handcuffed, pushed or grabbed, hit or kicked, used chemical or pepper spray, used an electroshock weapon, pointed or fired a gun, or used another type of physical force. Tapp & Davis (2022), see note 13.
Tapp & Davis (2022), see note 13.
Voigt, R., Camp, N.P., Prabhakaran, V., Hamilton, W.L., Hetey, R.C., Griffiths, C.M., Jurgens, D., Jurafsky, D., & Eberhardt, J.L. (2017). Language from police body camera footage. shows racial disparities in officer respect. Proceedings of the National Academy of Sciences, 114(25), 6521–6526.
These data exclude the minority of killings by police that do not involve a firearm. Muhammad et al. (2022), see note 10.
Edwards F, Lee H, Esposito M. (2019). Risk of being killed by police use of force in the United States by age, race-ethnicity, and sex. PNAS 116(34),16793–98.